Financial accounting is how accounting professionals document, compile and outline how a business performs financially over a discrete period of time. Unlike cost accounting, which is used primarily for internal short and long-term strategic planning, financial accounting focuses primarily on producing relevant documentation for outside parties interested in short- and long-term financial performance.
Small businesses, large corporations and nonprofits use the following financial statements produced for relevant parties: the Balance Sheet, the Cash Flow Statement and the Income Statement. When it comes to publicly traded companies, their financial accounting standards are overseen by generally accepted accounting principles (GAAP). It’s one way to provide a standardized means to communicate the business’s monetary details to potential and current shareholders, lenders, government oversight and tax enforcement agencies.
Balance Sheet
As the U.S. Securities and Exchange Commission (SEC) explains, the balance sheet is a financial statement that informs readers about a business’s assets, financial obligations and shareholders’ equity. It’s how a business documents its asset valuation, its financial obligations and cash holdings. It provides owners, lending institutions and investors a way to analyze a business. The current ratio shows the ratio of current assets to current liabilities. This is a way to evaluate a business’ ability to manage financial obligations over the next year. Shareholders’ equity represents how much cash would remain if the business satisfied all creditors and all assets were liquidated; whatever remains would be the property of the shareholders.
Income Statement
Released once a month, every quarter or once per year, an income statement reports revenue, expenses, and net earnings or losses of a company for a given period. A company’s net revenue is calculated by subtracting allowances for uncollectable accounts, discounts, etc. from a business’s gross sales or revenues. From there, subtract the cost of sales, or how much the lot of products or services cost to make for the accounting period, from the net revenues figure. This results in gross profit or gross margin. Depreciation, along with amortization, or the cost of machinery and equipment losing life over time, is subtracted from the gross profit figure.
From there, operating expenses, which aren’t directly attributable to product or service production but are running day-to-day operations, are deducted from the resulting gross profit figure. This number is now called income from operations or operating profit before interest and income expense. Depending on the number, the interest income or interest expense is either added or subtracted from operating profits to arrive at the operating profit before income tax. Finally, income tax is deducted, resulting in net profit (net income or net earnings) or net losses. For publicly traded companies, it gives investors insight as to how much the company is making per share, so-called “earnings per share” (EPS).
Statement of Cash Flow
Per the SEC, a statement of cash flow features three sections that detail sources and utilization of the business’ operating, financing and investing cash flows. It paints a picture of inflows and outflows of the business’s cash levels. At the end of the day, it helps anyone interested in the company’s financials, especially potential and current investors, see the latest status and trends of cash flow.
One way to calculate cash flow, according to the SEC, is to look at a company’s free cash flow (FCF). This is calculated as follows:
Free Cash Flow = Operating Cash Flow – Capital Expenditures
Free Cash Flow = $50 million – $20 million = $30 million
This information is helpful because free cash flow can help determine a company’s financial health, how well (or not) the business model is performing, and its overall likelihood of success moving forward. Additionally, understanding the difference in accounting methods is another helpful piece of financial accounting analysis.
Accrual Method vs. Cash Method
Accrual Method
When it comes to the accrual method, according to the Congressional Research Service, when a business is paid for services or products to be rendered in the future, the payment is permitted to be recognized as revenue only when the product or service has been rendered. When it comes to accounting for expenses that are presumably deductible, under the accrual method, the expense can be recorded when it’s experienced by the business, not when payment has been made to the utility, raw material supplier, etc.
Cash Method
If a consultant gets payment immediately but isn’t expected to do said job until the following month, this approach requires revenue to be recognized when the cash has been received. Similarly, when expenses are paid is when expenses are recorded.
Considerations
For any business that handles inventory or sells to customers on credit, accrual accounting is required by the Internal Revenue Service. Similarly, for companies with average gross receipts of revenues greater than $25 million for the past 36 months, the IRS mandates accrual accounting. For companies with average gross receipt of revenues of less than $25 million, depending on the exact circumstances of the company’s business nature, cash or accrual may be used.
Financial accounting provides investors, business owners, and those providing businesses with legal and accountability a way to monitor performance and compliance.
These articles are intended to provide general resources for the tax and accounting needs of small businesses and individuals. Service2Client LLC is the author, but is not engaged in rendering specific legal, accounting, financial or professional advice. Service2Client LLC makes no representation that the recommendations of Service2Client LLC will achieve any result. The NSAD has not reviewed any of the Service2Client LLC content. Readers are encouraged to contact a professional regarding the topics in these articles. The images linked to these articles are protected by copyright and should not be copied for any reason.
It is all about how much you keep after taxes – not what you earn from your job, a business, or investments. While it is always great to see fabulous investment gains, the only financial metric that really matters is what is in your bank account at the end of the day. One of the ways you can influence this is by minimizing the taxes you pay on your investments.
Unfortunately, many people do not think about how taxes impact their investment returns until near the end of the year; however, you should act all year round. Taking part in investment tax planning throughout the year will give you opportunities to keep more of what you earn. Here are some rules and strategies to keep in mind.
Know When to Take Your Losses
Psychologically, many investors are averse to taking losses, holding out to “make their money back.” Instead of emotion, logic and investment acumen needs to be applied here. If an investment does not have a fundamental reason to turn around, then you are better off selling it and taking a tax loss.
Losses reduce taxes on either your capital gains for the year or, when losses exceed gains, up to $3,000 on other income. Excess losses can be carried forward to future years. Plus, you will have the proceeds to reinvest in something more likely to produce a return.
Let Winners Run
Unlike long-term capital gains, short-term capital gains are taxed as ordinary income. This means your marginal income tax rate (the highest rate applied to you) can impact your investment gains.
While you should not let the tax tail wag the investment dog, ideally you want to hold a winning investment for at least a year and a day to benefit from long-term capital gains tax treatment. This means you will pay only a 20 percent maximum tax versus whatever your marginal rate is.
As with losses, the fundamentals of the investment are key. Therefore you should not sell a holding if you think the gains are at risk just to save on taxes. If you believe in the investment for the long term, then holding out for preferred capital gains treatment can be a clever idea.
Give the Gift of Appreciation
Making charitable donations you would not otherwise give is generally not a viable tax strategy. However, if you are already charitably inclined then consider donating stock or mutual funds instead of cash.
When you donate property such as stocks, your charitable deduction is based on the fair market value of the asset on the date of the gift. It is much better to do this than donate cash.
For example, if you have a stock you purchased for $35 and it is now worth $135, when you donate it you will receive a charitable deduction of $135. If you were to sell the stock first, you would have to pay tax on the $100 gains and then have only $103 to donate in cash – assuming you are in the 32 percent tax bracket. The only winner in this situation is the IRS; both you and the charity lose. This is because the charity is excluded from paying capital gains taxes on the appreciation that occurred while you owned the asset.
Hold Until You Die
This strategy does not benefit you directly, but rather your heirs. When someone inherits an asset such as real estate, stocks, bonds, mutual funds, etc., the cost basis of the asset is reset to the fair market value at the date of death.
This means that if you have stock in company XYZ that you bought for $50 and now it is worth $500, you would pay tax on the gain of $450 per share. However, your heir would pay $0 if he sold it on the day you died. If your heir continues to hold the stock, the benefit still applies as his cost basis in the stock of XYZ would reset to $500, so he will pay taxes only on gains over that amount.
Conclusion
While you should never cheat on your taxes or do anything unethical, it is foolish to pay any more than legally necessary to the IRS. Engage in investment tax planning year-round and you may see better after-tax returns and more money in your bank account.
How to Increase After-Tax Returns on Investments
October 1, 2022 · Blog, Tax and Financial News
⏱ 4 min read
It is all about how much you keep after taxes – not what you earn from your job, a business, or investments. While it is always great to see fabulous investment gains, the only financial metric that really matters is what is in your bank account at the end of the day. One of the ways you can influence this is by minimizing the taxes you pay on your investments.
Unfortunately, many people do not think about how taxes impact their investment returns until near the end of the year; however, you should act all year round. Taking part in investment tax planning throughout the year will give you opportunities to keep more of what you earn. Here are some rules and strategies to keep in mind.
Know When to Take Your Losses
Psychologically, many investors are averse to taking losses, holding out to “make their money back.” Instead of emotion, logic and investment acumen needs to be applied here. If an investment does not have a fundamental reason to turn around, then you are better off selling it and taking a tax loss.
Losses reduce taxes on either your capital gains for the year or, when losses exceed gains, up to $3,000 on other income. Excess losses can be carried forward to future years. Plus, you will have the proceeds to reinvest in something more likely to produce a return.
Let Winners Run
Unlike long-term capital gains, short-term capital gains are taxed as ordinary income. This means your marginal income tax rate (the highest rate applied to you) can impact your investment gains.
While you should not let the tax tail wag the investment dog, ideally you want to hold a winning investment for at least a year and a day to benefit from long-term capital gains tax treatment. This means you will pay only a 20 percent maximum tax versus whatever your marginal rate is.
As with losses, the fundamentals of the investment are key. Therefore you should not sell a holding if you think the gains are at risk just to save on taxes. If you believe in the investment for the long term, then holding out for preferred capital gains treatment can be a clever idea.
Give the Gift of Appreciation
Making charitable donations you would not otherwise give is generally not a viable tax strategy. However, if you are already charitably inclined then consider donating stock or mutual funds instead of cash.
When you donate property such as stocks, your charitable deduction is based on the fair market value of the asset on the date of the gift. It is much better to do this than donate cash.
For example, if you have a stock you purchased for $35 and it is now worth $135, when you donate it you will receive a charitable deduction of $135. If you were to sell the stock first, you would have to pay tax on the $100 gains and then have only $103 to donate in cash – assuming you are in the 32 percent tax bracket. The only winner in this situation is the IRS; both you and the charity lose. This is because the charity is excluded from paying capital gains taxes on the appreciation that occurred while you owned the asset.
Hold Until You Die
This strategy does not benefit you directly, but rather your heirs. When someone inherits an asset such as real estate, stocks, bonds, mutual funds, etc., the cost basis of the asset is reset to the fair market value at the date of death.
This means that if you have stock in company XYZ that you bought for $50 and now it is worth $500, you would pay tax on the gain of $450 per share. However, your heir would pay $0 if he sold it on the day you died. If your heir continues to hold the stock, the benefit still applies as his cost basis in the stock of XYZ would reset to $500, so he will pay taxes only on gains over that amount.
Conclusion
While you should never cheat on your taxes or do anything unethical, it is foolish to pay any more than legally necessary to the IRS. Engage in investment tax planning year-round and you may see better after-tax returns and more money in your bank account.
Disclaimer
These articles are intended to provide general resources for the tax and accounting needs of small businesses and individuals. Service2Client LLC is the author, but is not engaged in rendering specific legal, accounting, financial or professional advice. Service2Client LLC makes no representation that the recommendations of Service2Client LLC will achieve any result. The NSAD has not reviewed any of the Service2Client LLC content. Readers are encouraged to contact a professional regarding the topics in these articles. The images linked to these articles are protected by copyright and should not be copied for any reason.
According to JP Morgan Chase & Co., there are some sobering statistics for businesses’ cash flow challenges. Understanding how cash flow is measured and analyzed is an important step for businesses to monitor and adjust their operations plan to increase the chances of becoming and staying cash flow positive. For median small business, JPM sees the middle amount of daily cash outflows being $374 and average daily cash inflows of $381. The middle statistics for small businesses hold an average daily cash balance of $12,100 and an average of 27 cash buffer days in reserve.
Defining Free Cash Flow to Equity
The Free Cash Flow to Equity (FCFE) calculation measures how much money a company produces that can be dispersed to equity holders. One way to determine this figure is to subtract Capital Expenditures from Cash from Operations and add Net Debt Issued to the remaining figure.
FCFE = Money from Operations – Capital Expenditures + Net Debt Issued
Interpreting the FCFE’s Results
This metric helps businesses, investors and professional financial experts determine how much money is available for a business’ disbursement of dividends and/or share buybacks. The more easily dividends and share buybacks are available via a better FCFE, the better a company is performing financially.
Even though the FCFE can tell how much shareholders may receive, there is no requirement that any of that amount be paid to shareholders. This valuation is preferred for companies that do not pay a dividend. One alternate source of funding buybacks or dividends is through retained earnings from past quarters.
Free Cash Flow to the Firm (FCFF)
Looking at how well a business runs, this calculation examines a company’s cash flow health once taxes, investments, depreciation and working capital are deducted, along with factoring in costs for current and long-term assets. It evaluates how much money the business can disburse to equity and debtholders once the company satisfies these financial obligations.
It shows a company how much it has available to issue dividends, buy back shares or satisfy debt obligations. If the FCFF is negative, there is no consideration for investors as the business cannot meet existing bills and capital expenditures. When a negative result is found, there is reason to see if and why there’s not enough revenue; if it is a short-term need; or if the business model needs to be re-tooled.
How FCFF is Calculated
Free cash flow to the firm can be calculated with the following formula:
FCFF must be taken as a part of a holistic analysis whether it is an investor or the business itself analyzing numbers. If a business is reporting high FCFF figures, analysis must be taken to ensure long-term investment in business structures, cars/trucks, tooling and business development are accurately reported. If businesses institute collection protocols sooner than standard, run low inventories or extend satisfying their own financial obligation, it can lower what a business owes and revise its working capital numbers – but that is generally temporary.
With cash flow’s impact on a business’ operation so integral, understanding how it is calculated is the first step to making smarter operational and investment decisions.
Understanding Free Cash Flow
September 1, 2022 · Accounting News, Blog
⏱ 3 min read
According to JP Morgan Chase & Co., there are some sobering statistics for businesses’ cash flow challenges. Understanding how cash flow is measured and analyzed is an important step for businesses to monitor and adjust their operations plan to increase the chances of becoming and staying cash flow positive. For median small business, JPM sees the middle amount of daily cash outflows being $374 and average daily cash inflows of $381. The middle statistics for small businesses hold an average daily cash balance of $12,100 and an average of 27 cash buffer days in reserve.
Defining Free Cash Flow to Equity
The Free Cash Flow to Equity (FCFE) calculation measures how much money a company produces that can be dispersed to equity holders. One way to determine this figure is to subtract Capital Expenditures from Cash from Operations and add Net Debt Issued to the remaining figure.
FCFE = Money from Operations – Capital Expenditures + Net Debt Issued
Interpreting the FCFE’s Results
This metric helps businesses, investors and professional financial experts determine how much money is available for a business’ disbursement of dividends and/or share buybacks. The more easily dividends and share buybacks are available via a better FCFE, the better a company is performing financially.
Even though the FCFE can tell how much shareholders may receive, there is no requirement that any of that amount be paid to shareholders. This valuation is preferred for companies that do not pay a dividend. One alternate source of funding buybacks or dividends is through retained earnings from past quarters.
Free Cash Flow to the Firm (FCFF)
Looking at how well a business runs, this calculation examines a company’s cash flow health once taxes, investments, depreciation and working capital are deducted, along with factoring in costs for current and long-term assets. It evaluates how much money the business can disburse to equity and debtholders once the company satisfies these financial obligations.
It shows a company how much it has available to issue dividends, buy back shares or satisfy debt obligations. If the FCFF is negative, there is no consideration for investors as the business cannot meet existing bills and capital expenditures. When a negative result is found, there is reason to see if and why there’s not enough revenue; if it is a short-term need; or if the business model needs to be re-tooled.
How FCFF is Calculated
Free cash flow to the firm can be calculated with the following formula:
FCFF must be taken as a part of a holistic analysis whether it is an investor or the business itself analyzing numbers. If a business is reporting high FCFF figures, analysis must be taken to ensure long-term investment in business structures, cars/trucks, tooling and business development are accurately reported. If businesses institute collection protocols sooner than standard, run low inventories or extend satisfying their own financial obligation, it can lower what a business owes and revise its working capital numbers – but that is generally temporary.
With cash flow’s impact on a business’ operation so integral, understanding how it is calculated is the first step to making smarter operational and investment decisions.
Disclaimer
These articles are intended to provide general resources for the tax and accounting needs of small businesses and individuals. Service2Client LLC is the author, but is not engaged in rendering specific legal, accounting, financial or professional advice. Service2Client LLC makes no representation that the recommendations of Service2Client LLC will achieve any result. The NSAD has not reviewed any of the Service2Client LLC content. Readers are encouraged to contact a professional regarding the topics in these articles. The images linked to these articles are protected by copyright and should not be copied for any reason.
The US tax system is progressive, meaning that the more you earn the more you pay. For the years 2020-2022 there are seven different brackets for each year. Which bracket you are in depends on your taxable income; however, your bracket does not equal your tax rate.
Tax brackets work so that you pay part of your income at each level bracket as you move-up in income. In other words, someone in the 24% marginal rate bracket will pay 10% on part of their income, 12% on another part, 22% on yet another and finally 24% on everything else. In other words, moving into a higher tax bracket does NOT mean you pay higher taxes on all your income.
Below we will present comparative tables, so you change see the changes across the years, but before we do let’s look at how the rates and brackets have changes over the periods.
Evolution of Tax Rates and Brackets
The tax rates over the period are the same. There are seven brackets with progressive rates ranging from 10% up to 37% and they are the same over all three years.
Federal income tax rate brackets are indexed for inflation. The brackets are adjusted using the chained Consumer Price Index (CPI). There were no structural changes to the tax brackets in any of the periods, so the only impact are increases year-over-year due to the inflation indexing.
The inflation adjustment factor for 2022 was 3.1% for example. This caused the 22% rate bracket for single filer to increase from $81,051 up to $83,551.
Tax Rates and Brackets
Below are the 2020-2022 tables for personal income tax rates. Note, that the 2020 figures below are the amounts applicable to the income earned during 2020 and paid in 2021 when you file your taxes.
Tax Brackets & Rates
Single Taxpayers
2020
2021
2022
10%
0 – $9,875
10%
0 – $9,950
10%
0 – $10,275
12%
$9,875 – $40,125
12%
$9,951 – $40,525
12%
$10,276 – $41,775
22%
$40,126 – $85,525
22%
$40,526 – $86,375
22%
$41,776 – $89,075
24%
$85,526 – $163,300
24%
$86,376 – $164,925
24%
$89,076 – $170,050
32%
$163,301 – $207,350
32%
$164,926 – $209,425
32%
$170,051 – $215,950
35%
$207,351 – $518,400
35%
$209,426 – $523,600
35%
$215,951 – $539,900
37%
$518,401 and Over
37%
$523,601and Over
37%
$539,901 and Over
Married Filing Jointly and Surviving Spouses
2020
2021
2022
10%
0 – $19,750
10%
0 – $19,900
10%
0 – $20,550
12%
$19,751 – $80,250
12%
$19,901 – $81,050
12%
$20,551 – $83,550
22%
$80,251 – $171,050
22%
$81,051 – $172,750
22%
$83,551 – $178,150
24%
$171,051 – $326,600
24%
$172,751 – $329,850
24%
$178,151 – $340,100
32%
$326,601 – $414,700
32%
$329,851 – $418,850
32%
$340,101 – $431,900
35%
$414,701 – $622,050
35%
$418,851 – $628,300
35%
$431,901 – $647,850
37%
$622,051 and Over
37%
$628,301and Over
37%
$647,851 and Over
Married Filing Separately
2020
2021
2022
10%
0 – $9,875
10%
0 – $9,950
10%
0 – $10,275
12%
$9,875 – $40,125
12%
$9,951 – $40,525
12%
$10,276 – $41,775
22%
$40,126 – $85,525
22%
$40,526 – $86,375
22%
$41,776 – $89,075
24%
$85,526 – $163,300
24%
$86,376 – $164,925
24%
$89,076 – $170,050
32%
$163,301 – $207,350
32%
$164,926 – $209,425
32%
$170,051 – $215,950
35%
$207,351 – $311,025
35%
$209,426 – $314,150
35%
$215,951 – $323,925
37%
$311,026 and Over
37%
$314,151and Over
37%
$323,926 and Over
Heads of Housholds
2020
2021
2022
10%
0 – $14,100
10%
0 – $14,200
10%
0 – $14,650
12%
$14,101 – $53,700
12%
$14,201 – $54,200
12%
$14,651 – $55,900
22%
$53,701 – $85,500
22%
$54,201 – $86,350
22%
$55,901 – $89,050
24%
$85,501 – $163,300
24%
$86,351 – $164,900
24%
$89,051 – $170,050
32%
$163,301 – $207,350
32%
$164,901 – $209,400
32%
$170,051 – $215,950
35%
$207,351 – $518,400
35%
$209,401 – $523,600
35%
$215,951 – $539,900
37%
$518,401 and Over
37%
$523,601and Over
37%
$539,901 and Over
Conclusion
There are no dramatic changes in the rates or brackets for the years 2020-2022, nor are there structural changes currently expected from congressional action.
2020 Vs 2021 Vs 2022 Federal Income Tax Brackets
September 1, 2022 · Blog, Guest Article of the Month
⏱ 3 min read
The US tax system is progressive, meaning that the more you earn the more you pay. For the years 2020-2022 there are seven different brackets for each year. Which bracket you are in depends on your taxable income; however, your bracket does not equal your tax rate.
Tax brackets work so that you pay part of your income at each level bracket as you move-up in income. In other words, someone in the 24% marginal rate bracket will pay 10% on part of their income, 12% on another part, 22% on yet another and finally 24% on everything else. In other words, moving into a higher tax bracket does NOT mean you pay higher taxes on all your income.
Below we will present comparative tables, so you change see the changes across the years, but before we do let’s look at how the rates and brackets have changes over the periods.
Evolution of Tax Rates and Brackets
The tax rates over the period are the same. There are seven brackets with progressive rates ranging from 10% up to 37% and they are the same over all three years.
Federal income tax rate brackets are indexed for inflation. The brackets are adjusted using the chained Consumer Price Index (CPI). There were no structural changes to the tax brackets in any of the periods, so the only impact are increases year-over-year due to the inflation indexing.
The inflation adjustment factor for 2022 was 3.1% for example. This caused the 22% rate bracket for single filer to increase from $81,051 up to $83,551.
Tax Rates and Brackets
Below are the 2020-2022 tables for personal income tax rates. Note, that the 2020 figures below are the amounts applicable to the income earned during 2020 and paid in 2021 when you file your taxes.
Tax Brackets & Rates
Single Taxpayers
2020
2021
2022
10%
0 – $9,875
10%
0 – $9,950
10%
0 – $10,275
12%
$9,875 – $40,125
12%
$9,951 – $40,525
12%
$10,276 – $41,775
22%
$40,126 – $85,525
22%
$40,526 – $86,375
22%
$41,776 – $89,075
24%
$85,526 – $163,300
24%
$86,376 – $164,925
24%
$89,076 – $170,050
32%
$163,301 – $207,350
32%
$164,926 – $209,425
32%
$170,051 – $215,950
35%
$207,351 – $518,400
35%
$209,426 – $523,600
35%
$215,951 – $539,900
37%
$518,401 and Over
37%
$523,601and Over
37%
$539,901 and Over
Married Filing Jointly and Surviving Spouses
2020
2021
2022
10%
0 – $19,750
10%
0 – $19,900
10%
0 – $20,550
12%
$19,751 – $80,250
12%
$19,901 – $81,050
12%
$20,551 – $83,550
22%
$80,251 – $171,050
22%
$81,051 – $172,750
22%
$83,551 – $178,150
24%
$171,051 – $326,600
24%
$172,751 – $329,850
24%
$178,151 – $340,100
32%
$326,601 – $414,700
32%
$329,851 – $418,850
32%
$340,101 – $431,900
35%
$414,701 – $622,050
35%
$418,851 – $628,300
35%
$431,901 – $647,850
37%
$622,051 and Over
37%
$628,301and Over
37%
$647,851 and Over
Married Filing Separately
2020
2021
2022
10%
0 – $9,875
10%
0 – $9,950
10%
0 – $10,275
12%
$9,875 – $40,125
12%
$9,951 – $40,525
12%
$10,276 – $41,775
22%
$40,126 – $85,525
22%
$40,526 – $86,375
22%
$41,776 – $89,075
24%
$85,526 – $163,300
24%
$86,376 – $164,925
24%
$89,076 – $170,050
32%
$163,301 – $207,350
32%
$164,926 – $209,425
32%
$170,051 – $215,950
35%
$207,351 – $311,025
35%
$209,426 – $314,150
35%
$215,951 – $323,925
37%
$311,026 and Over
37%
$314,151and Over
37%
$323,926 and Over
Heads of Housholds
2020
2021
2022
10%
0 – $14,100
10%
0 – $14,200
10%
0 – $14,650
12%
$14,101 – $53,700
12%
$14,201 – $54,200
12%
$14,651 – $55,900
22%
$53,701 – $85,500
22%
$54,201 – $86,350
22%
$55,901 – $89,050
24%
$85,501 – $163,300
24%
$86,351 – $164,900
24%
$89,051 – $170,050
32%
$163,301 – $207,350
32%
$164,901 – $209,400
32%
$170,051 – $215,950
35%
$207,351 – $518,400
35%
$209,401 – $523,600
35%
$215,951 – $539,900
37%
$518,401 and Over
37%
$523,601and Over
37%
$539,901 and Over
Conclusion
There are no dramatic changes in the rates or brackets for the years 2020-2022, nor are there structural changes currently expected from congressional action.
Disclaimer
These articles are intended to provide general resources for the tax and accounting needs of small businesses and individuals. Service2Client LLC is the author, but is not engaged in rendering specific legal, accounting, financial or professional advice. Service2Client LLC makes no representation that the recommendations of Service2Client LLC will achieve any result. The NSAD has not reviewed any of the Service2Client LLC content. Readers are encouraged to contact a professional regarding the topics in these articles. The images linked to these articles are protected by copyright and should not be copied for any reason.
Inflation Reduction Act of 2022 (HR 5376) – This legislation was originally introduced as the Build Back Better Act, President Biden’s signature bill of 2021. After suffering defeat in the Senate, the bill was later revised with fewer provisions to enhance its likelihood of passage, and renamed the Inflation Reduction Act. The bill authorizes funding for investments in domestic energy production and manufacturing with the goal of reducing U.S. carbon emissions by 40 percent by 2030. The bill provides tax credits for clean energy home enhancements and electric vehicle purchases, permits Medicare to negotiate prescription drug prices,and extendslower healthcare premiums for insurance purchased via the Affordable Care Act program through 2025. Also billed as a deficit reduction tool, the legislation imposes a minimum 15 percent corporate tax rate on large businesses with more than $1 billion in reported income, and a 1 percent excise tax on corporate stock buybacks. Furthermore, the bill increases previously reduced funding for the IRS in order to help track down and recoup taxes unlawfully skirted by high income earners. Initially introduced on Sept. 27, 2021, the Act was passed by both the House and the Senate in August and signed into law on Aug. 16.
CHIPS and Science Act of 2022(HR 4346) – This legislation includes $280 billion in funding to build a domestic supply chain for semiconductor chips as well as scientific and technological research to help keep U.S. industries competitive. The bill authorizes new and expanded investments in STEM education for K-12 to community college, undergraduate and graduate education.The bill was enacted on Aug. 9.
Bipartisan Safer Communities Act (S 2938) – Introduced by Sen. Marco Rubio (R-FL) on Oct. 5, 2021, this Act expands background checks for anyone under age 21 who seeks to purchase firearms, and offers incentives for states to pass red flag laws to remove weapons from people deemed a threat to themselves or others. The bill provides $11 billion in funding for mental health services in schools and local clinics, and to support mental health courts, drug courts, veterans’ courts and extreme risk protection orders. The final version of the bill passed in the Senate on June 23 and in the House on June 24. President Biden signed the bill into law on June 25.
Honoring our PACT Act of 2022 (S 3373) – This legislation, which expands healthcare benefits for veterans who were exposed to burn pits and other toxic substances while on active duty, was introduced by Sen. Tim Kaine (D-VA) on Dec. 9, 2021. Amid much fanfare and controversy this summer, this bipartisan bill was finally passed in both the House (July) and the Senate (August, requiring a second vote) and was signed into law by President Biden on Aug. 10.
PPP and Bank Fraud Enforcement Harmonization Act of 2022 (HR 7352) – Introduced by Rep. Nydia Velazquez (D-NY) on March 31, this bill amends the Small Business Act to extend the statute of limitation to 10 years for criminal charges and civil enforcement against borrowers under the Paycheck Protection Program, enacted during the early stages of the COVID-19 pandemic. The bill passed in the House on June 8 and in the Senate on June 28. It was enacted on Aug. 5.
Productive Month Passing Domestic Manufacturing and Prescription Drug Allowances, Climate and Gun Violence Mitigation, and Veteran Burn Pit Healthcare Legislation
September 1, 2022 · Blog, Congress at Work
⏱ 3 min read
Inflation Reduction Act of 2022 (HR 5376) – This legislation was originally introduced as the Build Back Better Act, President Biden’s signature bill of 2021. After suffering defeat in the Senate, the bill was later revised with fewer provisions to enhance its likelihood of passage, and renamed the Inflation Reduction Act. The bill authorizes funding for investments in domestic energy production and manufacturing with the goal of reducing U.S. carbon emissions by 40 percent by 2030. The bill provides tax credits for clean energy home enhancements and electric vehicle purchases, permits Medicare to negotiate prescription drug prices,and extendslower healthcare premiums for insurance purchased via the Affordable Care Act program through 2025. Also billed as a deficit reduction tool, the legislation imposes a minimum 15 percent corporate tax rate on large businesses with more than $1 billion in reported income, and a 1 percent excise tax on corporate stock buybacks. Furthermore, the bill increases previously reduced funding for the IRS in order to help track down and recoup taxes unlawfully skirted by high income earners. Initially introduced on Sept. 27, 2021, the Act was passed by both the House and the Senate in August and signed into law on Aug. 16.
CHIPS and Science Act of 2022(HR 4346) – This legislation includes $280 billion in funding to build a domestic supply chain for semiconductor chips as well as scientific and technological research to help keep U.S. industries competitive. The bill authorizes new and expanded investments in STEM education for K-12 to community college, undergraduate and graduate education.The bill was enacted on Aug. 9.
Bipartisan Safer Communities Act (S 2938) – Introduced by Sen. Marco Rubio (R-FL) on Oct. 5, 2021, this Act expands background checks for anyone under age 21 who seeks to purchase firearms, and offers incentives for states to pass red flag laws to remove weapons from people deemed a threat to themselves or others. The bill provides $11 billion in funding for mental health services in schools and local clinics, and to support mental health courts, drug courts, veterans’ courts and extreme risk protection orders. The final version of the bill passed in the Senate on June 23 and in the House on June 24. President Biden signed the bill into law on June 25.
Honoring our PACT Act of 2022 (S 3373) – This legislation, which expands healthcare benefits for veterans who were exposed to burn pits and other toxic substances while on active duty, was introduced by Sen. Tim Kaine (D-VA) on Dec. 9, 2021. Amid much fanfare and controversy this summer, this bipartisan bill was finally passed in both the House (July) and the Senate (August, requiring a second vote) and was signed into law by President Biden on Aug. 10.
PPP and Bank Fraud Enforcement Harmonization Act of 2022 (HR 7352) – Introduced by Rep. Nydia Velazquez (D-NY) on March 31, this bill amends the Small Business Act to extend the statute of limitation to 10 years for criminal charges and civil enforcement against borrowers under the Paycheck Protection Program, enacted during the early stages of the COVID-19 pandemic. The bill passed in the House on June 8 and in the Senate on June 28. It was enacted on Aug. 5.
Disclaimer
These articles are intended to provide general resources for the tax and accounting needs of small businesses and individuals. Service2Client LLC is the author, but is not engaged in rendering specific legal, accounting, financial or professional advice. Service2Client LLC makes no representation that the recommendations of Service2Client LLC will achieve any result. The NSAD has not reviewed any of the Service2Client LLC content. Readers are encouraged to contact a professional regarding the topics in these articles. The images linked to these articles are protected by copyright and should not be copied for any reason.
Web browsers such as Google Chrome, Firefox, Safari and Edge, among others, play an essential role in enabling access to websites on the internet. Most browsers allow users to install extensions, also referred to as add-ons or plug-ins. These extensions are applications or small software modules that add functionality and other useful features to a browser.
By means of the extensions, users can carry out various tasks such as password management, cookie management, ad blocking, interface modification, productivity tracking, grammar and spell-checking, etc.
However, although the extensions offer different useful functionalities, cybercriminals have taken advantage of them, creating a security risk to users and their data.
The Need to Beware of Browser Extensions
Browsers enable websites to collect information such as viewing history, adding cookies, etc. Also, when installing the extensions, some require to be allowed various permissions, like the ability to read or change data. For instance, according to a recent study by Talon, a digital security company, most Chrome Web Store extensions (62.43 percent of extensions) require dangerous permissions, including permission to read or change user data and activity. This means that an extension can see the sites visited, keystrokes, login credentials and private data, such as payment card details.
Since this information is readily available on a user’s web browser, cybercriminals can use a malicious extension to collect the data for their gain. At the same time, the data collected is sold without user consent or knowledge and used by third-party data brokers to send users tailor-made ads.
Although not all browser extensions are a security risk, some might be built to impersonate legitimate extensions, especially those from third-party resources. In other cases, legitimate extensions have been compromised or bought by a developer who uses them for malicious purposes.
Some browser add-ons are built to download malware onto your device, redirect search traffic to malicious websites or download ad ware and Trojan horse viruses.
The extensions can automatically update without requiring any action from a user. This means that if a legitimate extension is compromised, it can be used to install malware without user knowledge. Even secure extensions are prone to attacks or can be compromised, enabling attackers to gain access to data stored by browsers.
Additionally, malicious extensions can be built to bypass fraud detection by official Web stores. For instance, in 2020, Google removed over 500 extensions from its web store that violated policies, with some already having infected users and stolen their data. This followed the discovery of some malicious extensions that users had already downloaded.
A recent report released by Kaspersky, a cybersecurity firm, shows just how dangerous malicious add-ons are. After the firm analyzed data from January 2020 to June 2022, it discovered that over this time frame, 4.3 million users were attacked by adware hiding in browser extensions. This put adware as the highest representative of browser extension risks, with malware coming second. The report also indicates that Kaspersky products prevented more than 6 million users from downloading adware, malware or riskware disguised as browser extensions.
Such figures from just one cybersecurity firm are worrying, considering the study focused only on users that use their security solutions. This creates a need for users to be more vigilant when using browser extensions.
How to Make Sure Browser Extensions Are Safe
There are various ways to help reduce the risks posed by browser extensions:
Ensure the extension is from an official web store. Since these extensions can also be compromised, it is best to find out more information about the developer.
Check reviews as they help to know what other users think of the extension and if there have been any complaints. However, users should be cautious of identical comments or too many 5-star reviews, as these could be fake.
Check whether the extension is updated regularly. An extension last updated many years ago might not be reliable.
Review extension permissions for each extension.
Check that you are not installing clones of the original extension. For instance, if you search for an extension, you can find other similar ones that look legit.
Uninstall browser extensions that you don’t recognize or those you no longer need.
Use browsers that have the features you want.
Install reliable antivirus software that will help spot malicious activities or applications.
Conclusion
Browser extensions play an important role in the user browsing experience. Although not all extensions are dangerous, users must conduct due diligence to ensure they install legitimate extensions.
Risk of Browser Extensions and How to Stay Safe
September 1, 2022 · Blog, What's New in Technology
⏱ 4 min read
Web browsers such as Google Chrome, Firefox, Safari and Edge, among others, play an essential role in enabling access to websites on the internet. Most browsers allow users to install extensions, also referred to as add-ons or plug-ins. These extensions are applications or small software modules that add functionality and other useful features to a browser.
By means of the extensions, users can carry out various tasks such as password management, cookie management, ad blocking, interface modification, productivity tracking, grammar and spell-checking, etc.
However, although the extensions offer different useful functionalities, cybercriminals have taken advantage of them, creating a security risk to users and their data.
The Need to Beware of Browser Extensions
Browsers enable websites to collect information such as viewing history, adding cookies, etc. Also, when installing the extensions, some require to be allowed various permissions, like the ability to read or change data. For instance, according to a recent study by Talon, a digital security company, most Chrome Web Store extensions (62.43 percent of extensions) require dangerous permissions, including permission to read or change user data and activity. This means that an extension can see the sites visited, keystrokes, login credentials and private data, such as payment card details.
Since this information is readily available on a user’s web browser, cybercriminals can use a malicious extension to collect the data for their gain. At the same time, the data collected is sold without user consent or knowledge and used by third-party data brokers to send users tailor-made ads.
Although not all browser extensions are a security risk, some might be built to impersonate legitimate extensions, especially those from third-party resources. In other cases, legitimate extensions have been compromised or bought by a developer who uses them for malicious purposes.
Some browser add-ons are built to download malware onto your device, redirect search traffic to malicious websites or download ad ware and Trojan horse viruses.
The extensions can automatically update without requiring any action from a user. This means that if a legitimate extension is compromised, it can be used to install malware without user knowledge. Even secure extensions are prone to attacks or can be compromised, enabling attackers to gain access to data stored by browsers.
Additionally, malicious extensions can be built to bypass fraud detection by official Web stores. For instance, in 2020, Google removed over 500 extensions from its web store that violated policies, with some already having infected users and stolen their data. This followed the discovery of some malicious extensions that users had already downloaded.
A recent report released by Kaspersky, a cybersecurity firm, shows just how dangerous malicious add-ons are. After the firm analyzed data from January 2020 to June 2022, it discovered that over this time frame, 4.3 million users were attacked by adware hiding in browser extensions. This put adware as the highest representative of browser extension risks, with malware coming second. The report also indicates that Kaspersky products prevented more than 6 million users from downloading adware, malware or riskware disguised as browser extensions.
Such figures from just one cybersecurity firm are worrying, considering the study focused only on users that use their security solutions. This creates a need for users to be more vigilant when using browser extensions.
How to Make Sure Browser Extensions Are Safe
There are various ways to help reduce the risks posed by browser extensions:
Ensure the extension is from an official web store. Since these extensions can also be compromised, it is best to find out more information about the developer.
Check reviews as they help to know what other users think of the extension and if there have been any complaints. However, users should be cautious of identical comments or too many 5-star reviews, as these could be fake.
Check whether the extension is updated regularly. An extension last updated many years ago might not be reliable.
Review extension permissions for each extension.
Check that you are not installing clones of the original extension. For instance, if you search for an extension, you can find other similar ones that look legit.
Uninstall browser extensions that you don’t recognize or those you no longer need.
Use browsers that have the features you want.
Install reliable antivirus software that will help spot malicious activities or applications.
Conclusion
Browser extensions play an important role in the user browsing experience. Although not all extensions are dangerous, users must conduct due diligence to ensure they install legitimate extensions.
Disclaimer
These articles are intended to provide general resources for the tax and accounting needs of small businesses and individuals. Service2Client LLC is the author, but is not engaged in rendering specific legal, accounting, financial or professional advice. Service2Client LLC makes no representation that the recommendations of Service2Client LLC will achieve any result. The NSAD has not reviewed any of the Service2Client LLC content. Readers are encouraged to contact a professional regarding the topics in these articles. The images linked to these articles are protected by copyright and should not be copied for any reason.
In our current economy, or anytime actually, it can’t hurt to have a side hustle to bring in extra cash. Some of these options can be quite lucrative, but like everything, it takes a little work to create a steady income stream. However, with a little pre-planning, you can do it. Let’s take a look.
Become a Tutor
Are you a math whiz? A wordsmith? History nut? Whatever your specialty, you can earn between $10 and $75 an hour. You might vary your price based on whether you’re tutoring high school, college or adult education classes. You can conduct your sessions online or in-person –totally up to you and your comfort level. All you have to do is create a lesson plan, then spread the word on social media, contact your local high schools and universities, or tack a notice near a central location such as a local coffee shop. When you’re sharing your knowledge and helping others, it might not feel like work at all.
Deliver Groceries with Instacart
If you haven’t heard of this, you might have seen people in grocery stores with their carts stuffed with brown paper bags full of items, list in hand – these are most likely Instacart workers. In sum, this gig is a same-day grocery delivery app. You shop for other folks; you don’t have to pay out-of-pocket when you’re at the store; and you can start earning money the very first week. Oh, and you get tips. According to ridester.com, you can make anywhere from $200 to $1,000 a week. Pretty easy and cool, right?
Rent an Extra Room Through Airbnb
While this might require some prep like buying extra towels and toiletries, as well as communicating with customers, you can make a lot in the long run. It might take a couple of months to get up and running, but you can bring in around 7 percent to 12 percent of your property value per year.
Help with Finances
If you have a background in accounting or finances, you might start up a business doing someone’s books, taxes or other services that have to do with money and/or budgeting. You can make from $20 to $100 an hour. Be sure to check with your city and state to find out what licenses and certifications you need.
Walk Dogs
Yes, dog walking can bring in more than you think. And you’ve probably seen these hearty souls on the sidewalks, sometimes with more than one furry friend in tow. If you live in a big city, there’s ample opportunity to make this work: you can make between $10 and $100 per day. And this is just a ballpark estimate. Plus, you’ll get your steps in. It’s healthy both fiscally and physically.
Write Resumes and Cover Letters
With all the job seekers out there, you could make a good chunk of change doing this. And you don’t necessarily need to be a writer. If you have a background in HR, recruitment or you’ve worked as a hiring manager, you’ll be ready to go. Hesitant about all that punctuation? One word: grammarly.com. This app will help you navigate all those writing questions you might have that inevitably come up when you’re composing. The average you might earn is somewhere in the neighborhood of $500 or more.
One Thing to Note
If you make more than $600, you must report it to the IRS. If you see that your side hustle is booming, if you start making thousands or tens of thousands of dollars a year, you might want to start a business. You could enjoy additional tax write-off opportunities so you can keep more of what you earn.
So start exploring, hang those shingles and watch the extra dough come rolling in.
These articles are intended to provide general resources for the tax and accounting needs of small businesses and individuals. Service2Client LLC is the author, but is not engaged in rendering specific legal, accounting, financial or professional advice. Service2Client LLC makes no representation that the recommendations of Service2Client LLC will achieve any result. The NSAD has not reviewed any of the Service2Client LLC content. Readers are encouraged to contact a professional regarding the topics in these articles. The images linked to these articles are protected by copyright and should not be copied for any reason.
During the first year of the pandemic, many homeowners spent their down time upgrading their homes. The year 2020 alone experienced at 3 percent uptick in spending on home improvements – to the tune of nearly $420 billion nationwide. This included modifications for remote work, online schooling and leisure activities at home.
Between remodeling, high inflation and today’s elevated real estate prices, it’s important to review your homeowner’s insurance policy to ensure it’s up-to-date. Does it include enough coverage for recent upgrades to your home? Does it carry an inflation factor to ensure coverage is on par with more expensive building material costs and labor increases? Do you have coverage for ancillary factors, such as the cost of meeting local building ordinances, or flood insurance for today’s extreme weather events?
Replacement vs. Actual Value
One term to check on your policy’s declaration page is whether your coverage is determined by replacement cost or actual cash value. Replacement cost will pay for repairs to your home or replace your personal property (e.g., laptop, television) up to coverage limits, regardless of its current value. In other words, the policy will pay for a new computer even if your old one was 3 years old.
Actual cash value refers to a cash payout equal to the current value of your property. In other words, if your computer was 3 years old, you will receive the cash value of a 3-year-old computer – which will not likely cover the cost of a new replacement.
Guaranteed Replacement
In lieu of upgrading your home’s cost coverage each year, you might have the option to pay for guaranteed replacement, which is an extra fee that ensures the policy will cover the entire cost to rebuild your home. Extended replacement cost coverage pays out a certain percentage above your policy’s stated dwelling coverage limit if the cost to rebuild is higher than the face amount. For example, a policy with $200,000 coverage and 25 percent extended replacement coverage will pay up to $250,000 to rebuild your home.
Ordinance Coverage
Homeowners who live in older homes should consider adding ordinance coverage if it is not standard under your policy. Ordinance coverage pays for the cost to meet current building codes should you need to rebuild. These fees can be substantial and would have to be paid out-of-pocket if you don’t have this form of coverage. Note, too, that although guaranteed replacement cost coverage might offer a higher payout, that is only for the material and labor costs to rebuild – not local ordinance fees, licenses or inspections.
Inflation Impact
As you review your current policy, note that the section labeled Coverage A represents the amount available to rebuild your home. It generally rises by 2 percent to 3 percent each year for basic cost-of-living increases. However, it is worth noting that building materials, such as lumber and steel, increased by 19 percent in 2021, and in June the general inflation rate increased to 9.1 percent, its highest level in more than 40 years.
Because home building costs, the inflation rate and the increasing number of weather events have plagued the home insurance industry, policy premiums are starting to increase at a higher rate each year than in the past. In additional to higher costs due to supply chain disruptions and inflation, the home building industry is hampered by a lack of qualified workers – and experienced workers are demanding higher pay. This is yet another component that is factored into calculating insurance premiums. Basically, anything that would lead to a higher cost to repair your home will result in higher rates.
Insurance companies calculate your policy premiums by multiplying your home’s replacement rate with your home’s current value. Therefore, a combination of higher building costs and higher real estate values have contributed to higher insurance premiums. Some states have set an annual percentage cap on how much insurance companies can raise homeowner rates each year. However, given the increasing number of extreme weather events (e.g., storm surge, wildfires) in recent years, state legislators also have increased those rate caps so that insurers have the latitude to cover excess payouts. Note that rate increases vary by geographical area, based on local weather activity, labor costs and building supplies.
Some insurance policies offer an inflation guard, which automatically increases coverage limits to match inflation rates when the policy is renewed.
Flood Damage
Be aware that homeowners insurance does not cover flood damage. Mortgage lenders require homes located in government-designated Special Flood Hazard Areas (SFHA) to purchase a separate flood insurance policy. However, we have seen inland and even metropolitan areas that are not located in flood zones be devastated by the effects of storm surge following a hurricane. Homeowners who live in these higher-risk areas should consider purchasing a separate flood insurance policy as well.
Should You Upgrade Your Homeowners Insurance?
September 1, 2022 · Blog, Financial Planning
⏱ 5 min read
During the first year of the pandemic, many homeowners spent their down time upgrading their homes. The year 2020 alone experienced at 3 percent uptick in spending on home improvements – to the tune of nearly $420 billion nationwide. This included modifications for remote work, online schooling and leisure activities at home.
Between remodeling, high inflation and today’s elevated real estate prices, it’s important to review your homeowner’s insurance policy to ensure it’s up-to-date. Does it include enough coverage for recent upgrades to your home? Does it carry an inflation factor to ensure coverage is on par with more expensive building material costs and labor increases? Do you have coverage for ancillary factors, such as the cost of meeting local building ordinances, or flood insurance for today’s extreme weather events?
Replacement vs. Actual Value
One term to check on your policy’s declaration page is whether your coverage is determined by replacement cost or actual cash value. Replacement cost will pay for repairs to your home or replace your personal property (e.g., laptop, television) up to coverage limits, regardless of its current value. In other words, the policy will pay for a new computer even if your old one was 3 years old.
Actual cash value refers to a cash payout equal to the current value of your property. In other words, if your computer was 3 years old, you will receive the cash value of a 3-year-old computer – which will not likely cover the cost of a new replacement.
Guaranteed Replacement
In lieu of upgrading your home’s cost coverage each year, you might have the option to pay for guaranteed replacement, which is an extra fee that ensures the policy will cover the entire cost to rebuild your home. Extended replacement cost coverage pays out a certain percentage above your policy’s stated dwelling coverage limit if the cost to rebuild is higher than the face amount. For example, a policy with $200,000 coverage and 25 percent extended replacement coverage will pay up to $250,000 to rebuild your home.
Ordinance Coverage
Homeowners who live in older homes should consider adding ordinance coverage if it is not standard under your policy. Ordinance coverage pays for the cost to meet current building codes should you need to rebuild. These fees can be substantial and would have to be paid out-of-pocket if you don’t have this form of coverage. Note, too, that although guaranteed replacement cost coverage might offer a higher payout, that is only for the material and labor costs to rebuild – not local ordinance fees, licenses or inspections.
Inflation Impact
As you review your current policy, note that the section labeled Coverage A represents the amount available to rebuild your home. It generally rises by 2 percent to 3 percent each year for basic cost-of-living increases. However, it is worth noting that building materials, such as lumber and steel, increased by 19 percent in 2021, and in June the general inflation rate increased to 9.1 percent, its highest level in more than 40 years.
Because home building costs, the inflation rate and the increasing number of weather events have plagued the home insurance industry, policy premiums are starting to increase at a higher rate each year than in the past. In additional to higher costs due to supply chain disruptions and inflation, the home building industry is hampered by a lack of qualified workers – and experienced workers are demanding higher pay. This is yet another component that is factored into calculating insurance premiums. Basically, anything that would lead to a higher cost to repair your home will result in higher rates.
Insurance companies calculate your policy premiums by multiplying your home’s replacement rate with your home’s current value. Therefore, a combination of higher building costs and higher real estate values have contributed to higher insurance premiums. Some states have set an annual percentage cap on how much insurance companies can raise homeowner rates each year. However, given the increasing number of extreme weather events (e.g., storm surge, wildfires) in recent years, state legislators also have increased those rate caps so that insurers have the latitude to cover excess payouts. Note that rate increases vary by geographical area, based on local weather activity, labor costs and building supplies.
Some insurance policies offer an inflation guard, which automatically increases coverage limits to match inflation rates when the policy is renewed.
Flood Damage
Be aware that homeowners insurance does not cover flood damage. Mortgage lenders require homes located in government-designated Special Flood Hazard Areas (SFHA) to purchase a separate flood insurance policy. However, we have seen inland and even metropolitan areas that are not located in flood zones be devastated by the effects of storm surge following a hurricane. Homeowners who live in these higher-risk areas should consider purchasing a separate flood insurance policy as well.
Disclaimer
These articles are intended to provide general resources for the tax and accounting needs of small businesses and individuals. Service2Client LLC is the author, but is not engaged in rendering specific legal, accounting, financial or professional advice. Service2Client LLC makes no representation that the recommendations of Service2Client LLC will achieve any result. The NSAD has not reviewed any of the Service2Client LLC content. Readers are encouraged to contact a professional regarding the topics in these articles. The images linked to these articles are protected by copyright and should not be copied for any reason.
Cost accounting is a type of accounting that analyzes a business’ complete production costs by looking at both variable and fixed costs. This includes the concepts of marginal costing, lean accounting, standard costing and activity-based costing. It’s used by a business’ management to evaluate fixed and variable costs involved in the manufacturing operations.
The initial step is to assess and document such costs one-by-one. Once production is finished, it will contrast projected costs to what actual costs ended up being and see how processes can be improved. Management gleans information on how funds are used, revenue is earned, and where funds might be misdirected. It can help businesses create greater productivity and financial efficiencies after analyzing such information.
Looking at it more in-depth, there are different types of costs analyzed. The first is fixed costs, such as a monthly mortgage or lease payment, or those that are static regardless of the production level. The next is a variable cost that correlates directly with the production level. Operating costs can be either fixed or variable, depending on each business’ type of operation. Other types of costs include direct or directly connected; and indirect costs, which are costs such as administrative expenses that are less directly associated with production.
Variable Cost Ratio
Variable Cost Ratio (VCR) looks at what percentage a business’ variable production costs is of its net sales. Businesses can calculate the VCR by:
VCR = Variable Costs / Net Sales. Net sales is a business’ gross sales after subtracting any discounting, customer returns and allowances.
It can also be calculated this way: VCR = 1 – Contribution Margin
If each widget’s variable unit cost is $40 and it sells for $200 individually, the VCR equals 0.2 or 20 percent. It’s also possible to be completed within a certain time frame. For example, if a single month’s total variable production costs are $6,000, and the business has revenues of $30,000 within that same month, the variable cost ratio is 0.2 or 20 percent.
The VCR shows if a company is able to earn a higher rate of revenues and a slower growth in input costs. It can help businesses determine when it hits an equilibrium between a loss and profit. It’s also important to note that fixed costs are excluded.
Marginal Costing
Marginal costing, or cost-volume-profit analysis, is a way to determine how much more it would cost a company to increase its manufacturing by one more widget.
It helps analyze the impact of varying levels of costs and volume on operating profit. This calculation looks at potentially profitable new products, sales prices to establish for existing products, and the impact of marketing campaigns. It assumes that the retail price and the variable and fixed costs per unit don’t change. It’s a way for businesses to calculate when they’ve developed a price point to cover all expenses. It also can indicate when the business can obtain profits at a particular price point and mix of manufacturing output. It’s a way for businesses to determine which levels are unprofitable, break-even and make a profit.
When it comes to determining how much sales volume a business needs to break even, the formula is as follows:
If a business is looking to determine its break-even sales revenue figure, it must determine what its fixed costs are and its contribution margin. This calculation would be as follows:
$210,000 in fixed costs and a contribution margin of 30 percent = 210,000 / 0.30 = $700,000
However, it’s important to note that there’s no profit with the first calculation. If the business wanted to make $100,000 in profit, it would add that to the $210,000 in fixed costs. This would be calculated as follows: $310,000 / 0.30 = $1,033,333.33
Considerations of Marginal Costing/Cost-Volume-Profit Analysis
This formula tells a company if a widget is profitable. The contribution margin is what’s left over after each item or a lot of items is sold after deducting the variable costs for the respective number of units sold. When the contribution margin exceeds the fixed cost for the item or respective number of units sold, this signifies a profit.
Companies that have the time and resources to analyze their performance beyond the traditional financial statements can see what’s right with their processes; but can more importantly, they can find out what’s wrong and how to fix it going forward.
How Cost Accounting Helps Businesses Measure Performance
September 1, 2022 · Blog, General Business News
⏱ 4 min read
Cost accounting is a type of accounting that analyzes a business’ complete production costs by looking at both variable and fixed costs. This includes the concepts of marginal costing, lean accounting, standard costing and activity-based costing. It’s used by a business’ management to evaluate fixed and variable costs involved in the manufacturing operations.
The initial step is to assess and document such costs one-by-one. Once production is finished, it will contrast projected costs to what actual costs ended up being and see how processes can be improved. Management gleans information on how funds are used, revenue is earned, and where funds might be misdirected. It can help businesses create greater productivity and financial efficiencies after analyzing such information.
Looking at it more in-depth, there are different types of costs analyzed. The first is fixed costs, such as a monthly mortgage or lease payment, or those that are static regardless of the production level. The next is a variable cost that correlates directly with the production level. Operating costs can be either fixed or variable, depending on each business’ type of operation. Other types of costs include direct or directly connected; and indirect costs, which are costs such as administrative expenses that are less directly associated with production.
Variable Cost Ratio
Variable Cost Ratio (VCR) looks at what percentage a business’ variable production costs is of its net sales. Businesses can calculate the VCR by:
VCR = Variable Costs / Net Sales. Net sales is a business’ gross sales after subtracting any discounting, customer returns and allowances.
It can also be calculated this way: VCR = 1 – Contribution Margin
If each widget’s variable unit cost is $40 and it sells for $200 individually, the VCR equals 0.2 or 20 percent. It’s also possible to be completed within a certain time frame. For example, if a single month’s total variable production costs are $6,000, and the business has revenues of $30,000 within that same month, the variable cost ratio is 0.2 or 20 percent.
The VCR shows if a company is able to earn a higher rate of revenues and a slower growth in input costs. It can help businesses determine when it hits an equilibrium between a loss and profit. It’s also important to note that fixed costs are excluded.
Marginal Costing
Marginal costing, or cost-volume-profit analysis, is a way to determine how much more it would cost a company to increase its manufacturing by one more widget.
It helps analyze the impact of varying levels of costs and volume on operating profit. This calculation looks at potentially profitable new products, sales prices to establish for existing products, and the impact of marketing campaigns. It assumes that the retail price and the variable and fixed costs per unit don’t change. It’s a way for businesses to calculate when they’ve developed a price point to cover all expenses. It also can indicate when the business can obtain profits at a particular price point and mix of manufacturing output. It’s a way for businesses to determine which levels are unprofitable, break-even and make a profit.
When it comes to determining how much sales volume a business needs to break even, the formula is as follows:
If a business is looking to determine its break-even sales revenue figure, it must determine what its fixed costs are and its contribution margin. This calculation would be as follows:
$210,000 in fixed costs and a contribution margin of 30 percent = 210,000 / 0.30 = $700,000
However, it’s important to note that there’s no profit with the first calculation. If the business wanted to make $100,000 in profit, it would add that to the $210,000 in fixed costs. This would be calculated as follows: $310,000 / 0.30 = $1,033,333.33
Considerations of Marginal Costing/Cost-Volume-Profit Analysis
This formula tells a company if a widget is profitable. The contribution margin is what’s left over after each item or a lot of items is sold after deducting the variable costs for the respective number of units sold. When the contribution margin exceeds the fixed cost for the item or respective number of units sold, this signifies a profit.
Companies that have the time and resources to analyze their performance beyond the traditional financial statements can see what’s right with their processes; but can more importantly, they can find out what’s wrong and how to fix it going forward.
Disclaimer
These articles are intended to provide general resources for the tax and accounting needs of small businesses and individuals. Service2Client LLC is the author, but is not engaged in rendering specific legal, accounting, financial or professional advice. Service2Client LLC makes no representation that the recommendations of Service2Client LLC will achieve any result. The NSAD has not reviewed any of the Service2Client LLC content. Readers are encouraged to contact a professional regarding the topics in these articles. The images linked to these articles are protected by copyright and should not be copied for any reason.
One highlight of the recently passed Inflation Reduction Act of 2022 (IRA; HR 5376) includes modifications to what is more commonly referred to as EV credits. Specifically, Section 30D of the Act is where the most important modifications are, and where the present tax credit for electric vehicles is spelled out in the U.S. Code. There is also new stimulus for previously owned electric vehicles, industrial vehicles and “alternative fuel refueling property.”
According to the Joint Committee on Taxation’s estimates, in lieu of what was previously known as the credit for plug-in electric vehicles, there is now a new clean vehicle credit. It is expected to be worth $7.5 billion over the next decade. Other noteworthy tax credits include $1.7 billion for “alternative fuel refueling property,” $1.3 billion available for buying a previously owned qualified plug-in EV, and $3.6 billion in tax credits for qualified commercial clean vehicles.
How the IRA Changes Section 30D and EV Tax Credits
For eligible, new clean vehicles, purchasers may receive $7,500 in federal tax credits and $4,000 for similarly used vehicles. It is important to note that taxpayers who purchase such vehicles are eligible for this tax credit if their modified adjusted gross income (MAGI) during the current or preceding tax year is no greater than $300,000 for joint filers; $225,000 for heads of household; and $150,000 for single filers. It is also limited to pickup trucks, vans, and sport utility vehicles up to a MSRP of $80,000. All other vehicles costing up to $55,000 are similarly eligible.
Critical Mineral Standards
Another important qualification for this tax credit is if the vehicle’s battery has a minimum threshold of critical minerals and if it has been processed in the required geographies. Section 30D(e) requires progressively increasing percentages of critical minerals either processed or extracted in the United States or another country the U.S. has an existing free-trade agreement with. If the stated percentages are recycled in North America, a vehicle’s battery components may also qualify for the tax credit.
Once guidance is issued by the U.S. Treasury and before the start of 2024, there must be at least 40 percent of eligible critical minerals to qualify. Vehicles placed in service in 2024 must have at least 50 percent critical minerals in their batteries. Critical minerals must be 60 percent, 70 percent and 80 percent of a battery’s components in 2025, 2026 and after Dec. 31, 2026, respectively. Dependent on future guidelines developed by the Internal Revenue Service, manufacturers will have to sign off on battery component makeup.
Requirements for Battery Manufacturing/Assembly Requirements
According to Section 30D(e)(2), prior to Jan. 1, 2024, at least half of the components of an EV battery must be assembled or manufactured in North America. Starting in 2024 and through 2025, 60 percent of a battery must meet such requirements. Beginning in 2026 through 2028, this requirement will increase by 10 percent annually, eventually requiring 100 percent of a battery’s construction to meet these standards beyond Dec. 31, 2028.
Other Considerations for Tax Credit Eligibility
If any critical minerals were extracted, handled or recycled by a “foreign entity of concern,” it is prohibited by the IRA for tax credit eligibility. Similarly, final assembly also must take place within North America to retain eligibility for the tax credit. Being considered a “qualified manufacturer” is another requirement that is necessary to maintain tax credit eligibility. This is any manufacturer that adheres to the EPA’s Title II Clean Air Act rules.
With the push for cleaner and greener energy evolving, this is one of many tax credits for consumers and businesses alike to reduce emissions and navigate the U.S. Tax Code.
Electric Vehicle Tax Credits and the Future of the Automotive Industry
September 1, 2022 · Blog, Tax and Financial News
⏱ 3 min read
One highlight of the recently passed Inflation Reduction Act of 2022 (IRA; HR 5376) includes modifications to what is more commonly referred to as EV credits. Specifically, Section 30D of the Act is where the most important modifications are, and where the present tax credit for electric vehicles is spelled out in the U.S. Code. There is also new stimulus for previously owned electric vehicles, industrial vehicles and “alternative fuel refueling property.”
According to the Joint Committee on Taxation’s estimates, in lieu of what was previously known as the credit for plug-in electric vehicles, there is now a new clean vehicle credit. It is expected to be worth $7.5 billion over the next decade. Other noteworthy tax credits include $1.7 billion for “alternative fuel refueling property,” $1.3 billion available for buying a previously owned qualified plug-in EV, and $3.6 billion in tax credits for qualified commercial clean vehicles.
How the IRA Changes Section 30D and EV Tax Credits
For eligible, new clean vehicles, purchasers may receive $7,500 in federal tax credits and $4,000 for similarly used vehicles. It is important to note that taxpayers who purchase such vehicles are eligible for this tax credit if their modified adjusted gross income (MAGI) during the current or preceding tax year is no greater than $300,000 for joint filers; $225,000 for heads of household; and $150,000 for single filers. It is also limited to pickup trucks, vans, and sport utility vehicles up to a MSRP of $80,000. All other vehicles costing up to $55,000 are similarly eligible.
Critical Mineral Standards
Another important qualification for this tax credit is if the vehicle’s battery has a minimum threshold of critical minerals and if it has been processed in the required geographies. Section 30D(e) requires progressively increasing percentages of critical minerals either processed or extracted in the United States or another country the U.S. has an existing free-trade agreement with. If the stated percentages are recycled in North America, a vehicle’s battery components may also qualify for the tax credit.
Once guidance is issued by the U.S. Treasury and before the start of 2024, there must be at least 40 percent of eligible critical minerals to qualify. Vehicles placed in service in 2024 must have at least 50 percent critical minerals in their batteries. Critical minerals must be 60 percent, 70 percent and 80 percent of a battery’s components in 2025, 2026 and after Dec. 31, 2026, respectively. Dependent on future guidelines developed by the Internal Revenue Service, manufacturers will have to sign off on battery component makeup.
Requirements for Battery Manufacturing/Assembly Requirements
According to Section 30D(e)(2), prior to Jan. 1, 2024, at least half of the components of an EV battery must be assembled or manufactured in North America. Starting in 2024 and through 2025, 60 percent of a battery must meet such requirements. Beginning in 2026 through 2028, this requirement will increase by 10 percent annually, eventually requiring 100 percent of a battery’s construction to meet these standards beyond Dec. 31, 2028.
Other Considerations for Tax Credit Eligibility
If any critical minerals were extracted, handled or recycled by a “foreign entity of concern,” it is prohibited by the IRA for tax credit eligibility. Similarly, final assembly also must take place within North America to retain eligibility for the tax credit. Being considered a “qualified manufacturer” is another requirement that is necessary to maintain tax credit eligibility. This is any manufacturer that adheres to the EPA’s Title II Clean Air Act rules.
With the push for cleaner and greener energy evolving, this is one of many tax credits for consumers and businesses alike to reduce emissions and navigate the U.S. Tax Code.
Disclaimer
These articles are intended to provide general resources for the tax and accounting needs of small businesses and individuals. Service2Client LLC is the author, but is not engaged in rendering specific legal, accounting, financial or professional advice. Service2Client LLC makes no representation that the recommendations of Service2Client LLC will achieve any result. The NSAD has not reviewed any of the Service2Client LLC content. Readers are encouraged to contact a professional regarding the topics in these articles. The images linked to these articles are protected by copyright and should not be copied for any reason.

 Financial accounting is how accounting professionals document, compile and outline how a business performs financially over a discrete period of time. Unlike cost accounting, which is used primarily for internal short and long-term strategic planning, financial accounting focuses primarily on producing relevant documentation for outside parties interested in short- and long-term financial performance.
 It is all about how much you keep after taxes – not what you earn from your job, a business, or investments. While it is always great to see fabulous investment gains, the only financial metric that really matters is what is in your bank account at the end of the day. One of the ways you can influence this is by minimizing the taxes you pay on your investments.
 According to JP Morgan Chase & Co., there are some sobering statistics for businesses’ cash flow challenges. Understanding how cash flow is measured and analyzed is an important step for businesses to monitor and adjust their operations plan to increase the chances of becoming and staying cash flow positive. For median small business, JPM sees the middle amount of daily cash outflows being $374 and average daily cash inflows of $381. The middle statistics for small businesses hold an average daily cash balance of $12,100 and an average of 27 cash buffer days in reserve.
 The US tax system is progressive, meaning that the more you earn the more you pay. For the years 2020-2022 there are seven different brackets for each year. Which bracket you are in depends on your taxable income; however, your bracket does not equal your tax rate.
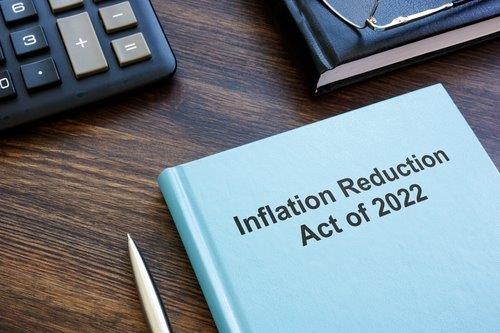 Inflation Reduction Act of 2022 (HR 5376) – This legislation was originally introduced as the Build Back Better Act, President Biden’s signature bill of 2021. After suffering defeat in the Senate, the bill was later revised with fewer provisions to enhance its likelihood of passage, and renamed the Inflation Reduction Act. The bill authorizes funding for investments in domestic energy production and manufacturing with the goal of reducing U.S. carbon emissions by 40 percent by 2030. The bill provides tax credits for clean energy home enhancements and electric vehicle purchases, permits Medicare to negotiate prescription drug prices,and extendslower healthcare premiums for insurance purchased via the Affordable Care Act program through 2025. Also billed as a deficit reduction tool, the legislation imposes a minimum 15 percent corporate tax rate on large businesses with more than $1 billion in reported income, and a 1 percent excise tax on corporate stock buybacks. Furthermore, the bill increases previously reduced funding for the IRS in order to help track down and recoup taxes unlawfully skirted by high income earners. Initially introduced on Sept. 27, 2021, the Act was passed by both the House and the Senate in August and signed into law on Aug. 16.
 Web browsers such as Google Chrome, Firefox, Safari and Edge, among others, play an essential role in enabling access to websites on the internet. Most browsers allow users to install extensions, also referred to as add-ons or plug-ins. These extensions are applications or small software modules that add functionality and other useful features to a browser.
 In our current economy, or anytime actually, it can’t hurt to have a side hustle to bring in extra cash. Some of these options can be quite lucrative, but like everything, it takes a little work to create a steady income stream. However, with a little pre-planning, you can do it. Let’s take a look.
 During the first year of the pandemic, many homeowners spent their down time upgrading their homes. The year 2020 alone experienced at 3 percent uptick in spending on home improvements – to the tune of nearly $420 billion nationwide. This included modifications for remote work, online schooling and leisure activities at home.
 Cost accounting is a type of accounting that analyzes a business’ complete production costs by looking at both variable and fixed costs. This includes the concepts of marginal costing, lean accounting, standard costing and activity-based costing. It’s used by a business’ management to evaluate fixed and variable costs involved in the manufacturing operations.
 One highlight of the recently passed Inflation Reduction Act of 2022 (IRA; HR 5376) includes modifications to what is more commonly referred to as EV credits. Specifically, Section 30D of the Act is where the most important modifications are, and where the present tax credit for electric vehicles is spelled out in the U.S. Code. There is also new stimulus for previously owned electric vehicles, industrial vehicles and “alternative fuel refueling property.”